Vector Tiles are an efficient way of displaying a large amount of data on a mapping control. The traditional approach of adding pushpins, or other layers in the browser fail with large amounts of data. The browser becomes sluggish when the number of points reaches 1000.
Colleagues of mine have produced an excellent workshop with detailed steps on how to build your own vector tile layers using Postgres, PostGIS, Geoserver and React.js. I was curious to find if there was a more ‘lightweight’ way of achieving the same goal.
In this post, I use three JavaScript libraries:
- geojson-vt calculates the features to render on a vector tile.
- vt-pbf encodes these features in a MVT protobuf format.
- OpenLayers is a browser based mapping component used to display the tiles.
We can build a simple vector tile server using node. The server will generate mapping tiles on the fly, and return them to the browser as protobuf encoded vector tiles.
Building the Tile Server
The vector data starts off in a GeoJSON format. This is loaded into geojson-vt. The getTile method then allows you to extract subsets of the data for any given tile.
// do this once on startup
const geojsonvt = require('geojson-vt')
const data = require('./geojson-source-data.json')
const tileIndex = geojsonvt(data)

...

// generate the vectors for an individual tile on each request
const tile = tileIndex.getTile(z, x, y)
To encode the data as an MVT tile, we need to use vt-pbf
// do this once on startup
const vtpbf = require('vt-pbf')

...

// encode the data as protobuf
const buffer = Buffer.from(vtpbf.fromGeojsonVt({ geojsonLayer: tile }))
Bringing it all together, this is what our node app looks like:
const http = require('http')
const geojsonvt = require('geojson-vt')
const vtpbf = require('vt-pbf')
const data = require('./geojson-source-data.json')

// build the tile index from GeoJSON source data
const tileIndex = geojsonvt(data)

const port = process.env.PORT || 8080
http.createServer(handleRequest).listen(port)
console.log(`listening on port ${port}`)

// expects urls in the format: /{Z}/{X}/{Y}.pbf
function handleRequest(req, res) {
  const [z, x, y] = req.url
    .replace('.pbf', '')
    .split('/')
    .filter(n => n)
    .map(n => parseInt(n))

  // get the vectors for this tile
  const tile = tileIndex.getTile(z, x, y)

  // if there is no tile data, return an empty response
  if (!tile) {
    res.writeHead(204, { 'Access-Control-Allow-Origin': '*' })
    return res.end()
  }

  // encode as protobuf
  const buffer = Buffer.from(vtpbf.fromGeojsonVt({ geojsonLayer: tile }))

  // write the buffer to the response stream
  res.writeHead(200, {
    'Content-Type': 'application/protobuf',
    'Access-Control-Allow-Origin': '*'
  })
  res.write(buffer, 'binary')
  res.end(null, 'binary')
}
The dependencies can be installed with npm:
> npm install geojson-vt vt-pbf --saveBuilding the UI
We can use OpenLayers to display the vector tiles.
We can configure the layer as follows:
const vectorLayer = new ol.layer.VectorTile({
  source: new ol.source.VectorTile({
    format: new ol.format.MVT(),
    url: 'http://127.0.0.1:8080/{z}/{x}/{y}.pbf'
  }),
  style: function(feature) {
    return new ol.style.Style({
      stroke: new ol.style.Stroke({
        color: 'rgba(30, 30, 30, 0.5)',
        width: 2
      })
    })
  }
})
And then add it to the map component:
const map = new ol.Map({
  target: 'map',
  layers: [vectorLayer],
  view: new ol.View({
    center: ol.proj.fromLonLat([149.13, -35.29]),
    zoom: 13
  })
})
The whole HTML file looks like this:
<!DOCTYPE html>
<html>
<head>
<title>Vector Tile Example</title>
<link
rel="stylesheet"
href="https://openlayers.org/en/v5.3.0/css/ol.css"
type="text/css"
/>
<script src="https://cdn.rawgit.com/openlayers/openlayers.github.io/master/en/v5.3.0/build/ol.js"></script>
<style>
.map {
width: 100%;
height: 100vh;
}
body {
margin: 0;
}
</style>
</head>
<body>
<div id="map" class="map"></div>
<script>
const tileLayer = new ol.layer.Tile({
source: new ol.source.Stamen({ layer: 'terrain-background' })
})
const vectorLayer = new ol.layer.VectorTile({
source: new ol.source.VectorTile({
format: new ol.format.MVT(),
url: 'http://127.0.0.1:8080/{z}/{x}/{y}.pbf'
}),
style: function(feature) {
return new ol.style.Style({
stroke: new ol.style.Stroke({
color: 'rgba(30, 30, 30, 0.5)',
width: 2
})
})
}
})
const map = new ol.Map({
target: 'map',
layers: [tileLayer, vectorLayer],
view: new ol.View({
center: ol.proj.fromLonLat([149.13, -35.29]),
zoom: 13
})
})
</script>
</body>
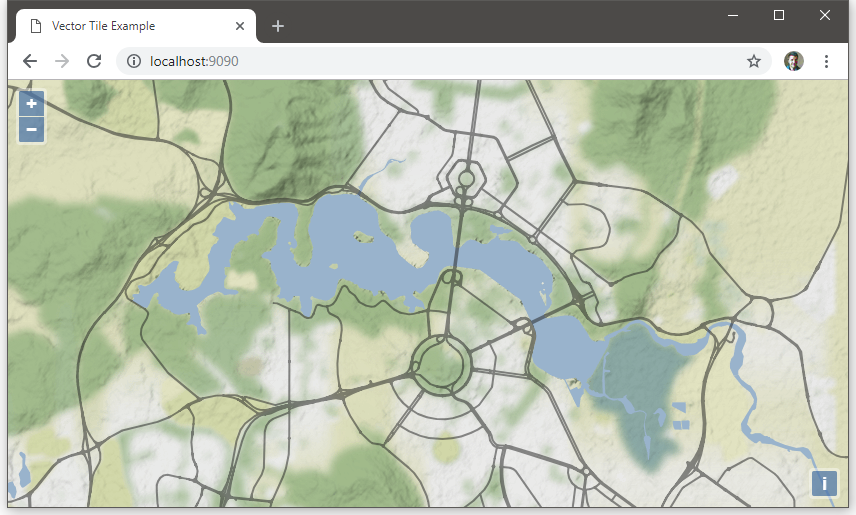
</html>Conclusion
In conclusion, it’s possible with a few lines of node.js, to build a vector tile service from a GeoJSON source file, without the need for a database. From my simple experiments, the tiles are generated quickly, and with a low payload size. This is probably a good solution if your source data is fairly low volume and changes infrequently.